

There is one global trend that trumps all others, and it’s not the president and his tariffs. It’s the alarming rate at which climate change catastrophes are becoming more frequent, costly, and intense. Against this onslaught sits the greatest challenge of the 21st century: how to feed a predicted 10 billion people—about 2 billion more than now—by 2050. Right, this century goes on for another 50 years after that, but that period will be moot for much if not most of humanity if our food system collapses—and with it the global social order—over the next 25. In my Nov. 5 post, I summarized this age-defining situation in a short video. Now I’m distilling it down into just one graphic, in hopes of making it even easier to grasp the inescapable urgency it presents. For those who at least a little need backup evidence, I’ve added two more slides as Addendums. Nevertheless, this graphic (below) conveys the wholeness of the challenge. Its unsparing charge is that the lower four blue lines of food production strategies will soon clash with the red line of climate change disasters.
It was a group of food security podcasts I recently pondered that spurred me to come up with a more effective wake-up call. The first two were staged by the IFPRI (the International Food Policy Research Institute, an arm of the UN) that altogether lasted three hours. They were filled with reverberating rounds of word salad research policy, in which no action emerged that had in any way reduced food insecurity in the past, or potentially could in the future. The goal seemed to be just doing ever more research. The second two podcasts centered around food sovereignty, the right to operate local food-processing enterprises, and the like. They lasted 45 minutes each, and were refreshingly more like ordinary people having a friendly conversation. Admirable enough as far as they went, but they revealed no grasp of what it would take to scale their somewhat romanticized ideals to feed many millions.
The IFPRI talks did bring up climate change disasters, but only in passing, as if they were no more than an ongoing nuisance. That is, continuing at a normalized pace, rather than the sharply increasing reality. The two food sovereignty talks didn’t mention the disasters at all. So if these podcasts are representative of food system specialists ranging from global to local perspectives, it’s clear that environmental disasters are still eh – meh inconsequential for most people. I certainly haven’t seen any evidence to the contrary in the mainstream media.
So will this all-in-one graphic pack enough punch to spur meaningful action? And if so, at the level of gardeners as well as thought leaders? Maybe only with the help of the two Addendums? Or will we have to wait until things get much worse? You be the judge.
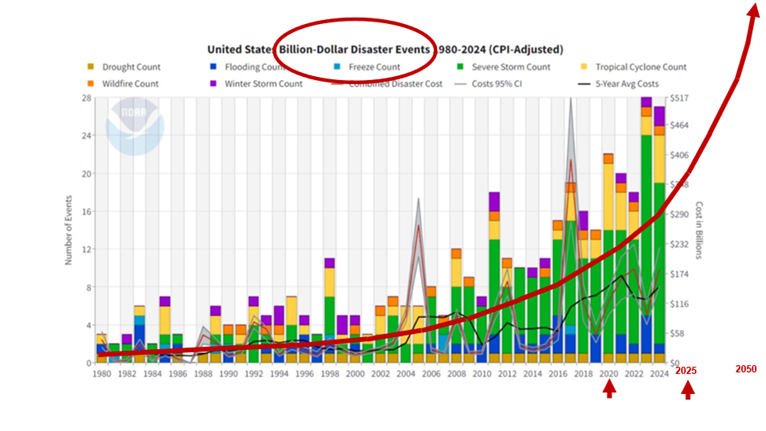
Consider first the red line. It indicates the rate at which U.S. billion-dollar disasters will continue to increase over the next 25 years, based on the last 10 years, according to NOAA1. This is an exponential rate of increase, amplified by the fact that the first half of 2025 was the costliest six months of weather disasters on record.2 In other words, the curve is tilting ever more steeply upward.
Now look at the lower, four blue dashed lines, which represent the rates at which various methods of food production are remaining constant or increasing. Unlike the red line, the rates of increase are best-evidence guesses, but they’re nonetheless linear and feature a low rise-to-run slope, so all of them will intersect the red line sometime soon. What does that mean?
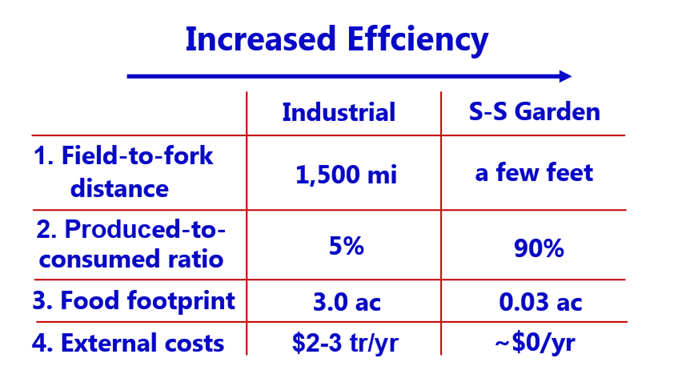
Start with the current baseline, the rate at which food is not only produced, but also consumed. Recall that the current production-to-consumption ratio could be as low as 5% in the industrial food system. This baseline represents the least adaptive rate of change, so with it we’d run into trouble sooner than with the others. Second is regenerative agriculture, only slightly more adaptive for meeting food needs. The third is the industrial system, assuming it will become somewhat more efficient in the coming years3, but still nowhere near enough to stay ahead of food demand for 10 billion by 2050. I place current gardens as a somewhat more promising option, based on their Johnny-on-the-spot performance as victory gardens in WWII. However, as I’ve covered previously, even the average American garden will be enough compared to self-sufficiency gardens.
What it all boils down to
As I said earlier, the unsparing message in this graphic is that the lower four blue-line food production strategies will soon clash with the red line of climate change disasters. News stories already document accelerating crop challenges due to increasing heat waves, drought, floods, fires, and scarcity of irrigation water. However, as I’ve indicated previously, the food system will most likely see a steadily cascading failure, not an overnight collapse (but see tipping points, below). I’ve indicated the gradual nature of this cascade by the steadily fading “Decreasing ability to meet demand” lines. The four lower blue lines thus denote varying time frames, depending on how low their slopes are, but all of them indicate breakdown within the next 10 to 15 years or so. By contrast, the steeply sloped solid blue line—that of a self-sufficiency garden food system—does not cross the red line, as will be discussed shortly.
All four of the low-slope lines are based on my conjecture except for the most important one: the industrial system. That one comes from a mega-study by Hultgren et al., published in 2025 in the prestigious journal Nature: “Impacts of climate change on global agriculture accounting for adaptation” 3. It concluded that the global ability to adapt food systems will fulfill just 23% of what will be needed to feed the world by 2050, according to longitudinal (as opposed to scenario) calorie-based data of six staple crops over 12,648 global regions. Surprisingly, the areas that will experience the greatest challenge to adapt will be not impoverished countries in Africa, but modern bread-baskets in wealthy countries, such as the American Midwest. A bevy of other mega-studies published in 2025 also cite challenges or proposals about how to feed the world or mitigate climate change4-8. However, none of them boast a compelling record of prior long-term success at scale.
Tipping points
In addition to the gradual, linear breakdown scenarios, it’s likely that there will be tipping points along the way, depicted in the graphic by the red stars. When and where they will occur depends on which of the four lower blue lines turns out to be most in play, with increased adaptivity of a given strategy pushing the point further into the future. Key characteristics of such triggers are:
- Threshold Behavior: Gradual change in the food system, such as ever-increasing food prices, decreasing food security, and increasing food recalls may eventually hit a point where the system’s behavior fundamentally changes. This could be due to serious loss of confidence that the industrial system can reliably supply food, causing people to start hoarding. In as much as grocery stores have only a three-day supply of food, this could easily trigger a spree of panic buying.
- Abrupt Change: A tipping point transition isn’t always slow; it can happen suddenly once a threshold is crossed. One way this could happen is with the bird flu. It’s already caused over 166 million birds to be culled (killed) in the U.S. since 2022. What if it suddenly mutates into a form virulent enough incapacitate or kill other farm animals (such as dairy cows, where it’s already widespread, though not yet deadly), or even humans? (Again, some people have already caught it, though the mortality rate is very low.) This also could precipitate a loss of confidence in the food system, which could cascade much quicker than one resulting from increasing food prices.
- Feedback Loops: This where an initial change triggers processes that amplify it, with reinforcing back-loops that make things worse and worse. A classic example in industrial agriculture is the pesticide treadmill: farmers apply chemical poisons to kill pests or keep them from reducing yields, to which the pests (or weeds) adapt, prompting applications of more or stronger pesticides, or GMOs, to which the pests also adapt, causing ever more toxic and stronger applications to control ever-adapting pests. Meanwhile, the air, surface water, and soils get ever more filled with toxic chemicals. Sooner or later, it will reach a tipping point, perhaps in the form of too many people getting cancer from farm chemicals, to where it triggers the public to leave the industrial system en masse.
- Irreversibility: Often, once a tipping point is reached, it’s very difficult or impossible to return to its original state, even if the initial trigger is removed. There are many such points in the industrial food system and its outcomes where this could happen. One example may be toxic “forever” pesticides (PFAS, Per- and Polyfluoroalkyl Substances). Once released into the environment, they continue to build up toxicity indefinitely due to their extremely slow rate of decomposition. Yet they can’t be removed. Another example could be the current global rate of obesity due to widespread consumption of ultra-processed foods. It may be reversible, but only very slowly because of industry attempts to first squeeze every drop of profit out of the obesity gravy-train before the UPF spigot is finally turned off by a wised-up public.
Of course, there is also such a thing as a positive tipping point, with its own potential for beneficial threshold behavior, abrupt change, feedback loops, and irreversibility. This possibility is depicted in the graphic by the gold star on the solid blue line. It’s the point at which self-sufficiency gardens branch off from ordinary gardens, thereby increasing the adaptivity slope of the blue line, which in turn allows them to stay ahead of the ominous red climate-change line. Like the latter, it will have an exponentially increasing slope; it has to be in order to keep ahead of the increasing rate, cost, and intensity of climate change disasters.
Rather than slowly dissolving like the other blue lines, the post-tipping point garden line remains solid blue, depicting an ability to stay strong and produce enough food to keep ahead of population increase and food demand. The reason it is likely to accomplish that is because a self-sufficiency garden food system is orders of magnitude more efficient than the industrial system (and likely the other blue-line methods as well), even if it improves its adaptability by the 23% that Hultgren, et al.3 predict. This outcome is indicated on the right by the four lower blue line strategies being too inefficient to meet food demand. To which the solution is to greatly increase efficiency, as would be manifested by the self-sufficiency garden system.
So there you have it, all I’ve been crowing about since January distilled down into just one graphic. However, it’s so condensed that, even with all the explanation I’ve just provided, there are bound to be those who would like to see—or be reminded of—at least a little supporting evidence. I thus add here a couple Addendums.
Addendum I – Billion-dollar disasters
The first is the one I’ve repeatedly shown: the NOAA-depicted rate at which billion-dollar disaster have increased from 1980 to 2024.1 The red line is not part of the original graphic; I added it, and extended it into the next 25 years to illustrate and emphasize how extraordinarily serious it will be as it climbs inexorably onward and upward into the future. It is truly scary, yet most people are still oblivious to its threat despite the recent Helene floods, LA Fires, and other disasters that keep piling up.
Addendum II – Food system efficiency, compared.
Again, you’ve seen this table before, a number of times. It’s even more invisible to most people than the billion dollar graphic, just because it so resoundingly flouts the prevailing narrative that the industrial food system is a modern wonder with its supposed economy of scale. In reality, that economic miracle belongs to self-sufficiency gardens, as both my research and the example of Russia’s household gardens have shown.
1Smith, A.B. 2025. 2024: An active year of U.S. billion-dollar weather and climate disasters. https://www.climate.gov/news-features/blogs/beyond-data/2024-active-year-us-billion-dollar-weather-and-climate-disasters
2Bush, E. 2025. What canceled climate data would have shown: The costliest 6 months of weather disasters on record. NBC News. https://www.nbcnews.com/science/climate-change/climate-change-data-costliest-6-months-weather-disasters-noaa-rcna238752
3Hultgren, A., et al. 2025. Impacts of climate change on global agriculture accounting for adaptation. Nature. https://www.nature.com/articles/s41586-025-09085-w
4West, P. et al. 2025. Only half of the calories produced on croplands are available for human consumption. Research Gate (preprint). https://www.researchgate.net/publication/394005686_Only_half_of_the_calories_produced_on_croplands_are_available_for_human_consumption#:~:text=Abstract%20and%20Figures,every%20calorie%20of%20boneless%20meat.
5Carswell, A.M., et al. 2025. Agricultural practices can threaten soil resilience through changing feedback loops. NPJ Sustainable Agriculture. https://www.nature.com/articles/s44264-025-00098-6#Tab1
6International Food Policy Institute. 2025. Food Policy: Lessons and Priorities for a Changing World. Global Food Policy Report. https://www.ifpri.org/global-food-policy-report/
7Rockström, J. et al. The EAT-Lancet Commission on healthy, sustainable, and just food systems. The Lancet. https://www.thelancet.com/commissions-do/EAT-2025
8Vickers, C.E. and Zerbe, P. 2025. Harnessing plant agriculture to mitigate climate change: A framework to evaluate synthetic biology (and other) interventions. Plant Physiology, Volume 199, Issue 3, November.

0 Comments