

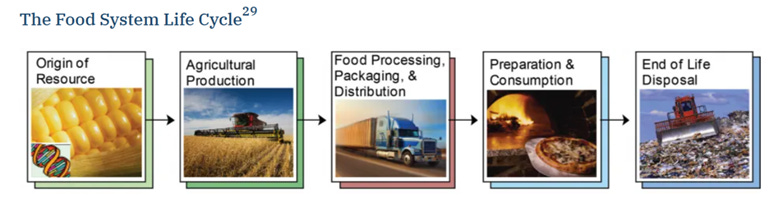
One of the most exasperating tropes that crops up among food system media and analysts is the idea that industrial food production equals consumption. Because it’s such a colossal mistake—and one that misleads the public again and again—I’d like to revisit just how much of the harvest from cropland and pasture makes it to the consumer’s fork. This is what I call the produced-to-consumed ratio. I’ve previously cited the University of Michigan study showing that, for the U.S. industrial food system, the ratio was 15%. You’ve seen this graphic before; it shows how 85% of the harvest dropped out of the food chain along it’s 1,500-mile journey from field to fork, leaving only 15% that was consumed. Note that I use the past tense here, because that was in 1995, 30 years ago.
I’ve often wondered what the material food flow would look like today, and why (to my knowledge) no one had done a thorough update to this study. Well, now someone has, namely Paul West and his colleagues at the University of Minnesota. As of this writing, the study is still a pre-print1, which means it’s been published online for anyone to review, but has not yet been accepted for official publication by a scientific journal. In any case, it reports that only half of the calories produced on croplands are available for human consumption. So by calorie count, 50% of the field harvest gets to the average fork, quite a bit more than the 15% in 1995, let alone the 5% that I’ve estimated for the present. But the methodologies of these two studies are so different, it’s not just comparing apples and oranges, it’s more like comparing peanuts and watermelons. It’s thus not so much a question of who’s right as what new developments mean and how you count the food. So here goes.
Cropland vs pasture and range land
In its tallies of calories, the Minnesota study counted only those produced on cropland. This is the land devoted to crops grown mainly for food (directly or indirectly), like corn, wheat, rice, potatoes, soybeans, carrots, etc. It differs from pasture and rangeland, where ruminants like cows, sheep, and goats harvest their food either directly from the land as grass, or indirectly in the form of hay and other forage such as alfalfa.
While the Minnesota study considered some 50 crops, it did not include the pasture-sourced grass and hay that make up most of the global feed for cattle. And cattle account for about half of the losses in the U.S. field-to-fork material food flow. True, the great majority of U.S. and European cattle are now fed on corn and soybean meal (instead of the grass they evolved to eat) in CAFOs (concentrated animal feeding operations), which other countries are now adopting. However, most of the world’s cattle still consume either grass in pastureland or hay. Less industrialized countries just do not have—on average—the infrastructure to support CAFOs on a large scale. Nearly all of India’s vast beef output, for example, comes from water buffalo, most if not all of which are pasture-fed. And cattle in Brazil, another mega-beef producer, are still mostly fed on pastureland, as are cattle in nearly all other non-European countries, especially in Africa. If the calories in all the grass and hay consumed by cattle had been counted, it would add quite a bit to the loss of calories in the Minnesota study, resulting in a significantly lower produced-to-consumed ratio.
Biomass versus calories
The Michigan study counted food in terms of biomass at the point of harvest, in harvested form. That would be everything from watermelons to shelled corn and soybeans to whole-grain wheat to potatoes and squash. Thus, biomass basically translates into whole, freshly harvested food weight. By contrast, the Minnesota study counted food in terms of calories, which on average depict only a fraction of whole food, though close to 100% of its energy content. Because biomass includes water, which on average comprises a larger percentage of whole food than calories, and because a lot of water is lost in the food chain, in which much less of total calories drop out, you would expect a much larger percentage of biomass being lost than calories. Hence, a notably lower produced-to-consumed ratio.
Food waste
I was surprised that the authors of the Minnesota study didn’t include pasture-derived calories, and didn’t even cite the Michigan study, but I was even more puzzled that they didn’t count the calories lost in global food waste. After all, it’s not an unknown or insignificant source of calories, as a whopping 30-40% of the food the world produces is wasted every year. In terms of totals, China discards an estimated 109 million tonnes a year, India 78 million, and the U.S. 25 million. France and Germany come in at 4-7, while smaller countries like the Philippines waste around 3 million. Per capita, the figures for the U.S. are 73 and India 55 kg/year. Again at the other end of the spectrum, the Philippines wastes 26 kg of food a year per capita. These figures come from the United Nations Environment Programme’s Food Waste Report 20242. But take a look at this quote:
“The UNEP estimates that in 2022, the world produced 1.05 billion tonnes of food waste across the retail, food service and household sectors. The average amount of food waste per capita that year is estimated to be 132 kg, of which 79 kg was household waste.”
Note that for the UNEP, as with many studies of wasted food, waste is counted only at the retail, food service, and household levels. In other words, only after the food has largely been processed. Yet the Michigan study shows that substantial waste occurs during harvest as well as all the steps of processing, especially as “respiration, animal waste, and live animals” in the sector of “Feed to livestock and poultry”, which alone uses up about 50% of total harvest. But even if you don’t count those considerable animal-related losses and waste, the food chain graphic still indicates 148,470 additional pounds lost due to processing, while only 96,270 pounds were lost to retail and food service. Plus, of the 355,800 pounds of “Edible food supply” in the graphic, 259,610 were “consumed”, meaning that consumers wasted 96,190 pounds, or only 27% of what was available to them.
This has long been the narrative among industrial food system analysts: consumers, not industry, are mostly to blame for food waste. Well, only if you don’t count the waste that happens before consumers get their hands on the food; how could they be held responsible for food that’s wasted before it reaches them? Therefore, the claim that 79 out of 132 kg per capita of food waste (60%) is due to household waste is utterly misleading, especially since global per capita food waste has increased since 1995. In fact, the World Bank reports that the U.S. alone saw a 50% rise in food waste over a 30-year period through 20173. The fact that the Minnesota study doesn’t consider the calories in food waste at all is thus highly pertinent.
So if all the calorie losses unaccounted for in the Minnesota study were included, it would reveal a considerably greater loss of food than the 50% implied in the report. That is, calorie losses in grass/hay cattle feed not being counted; calories rather than biomass being used as a measure of food loss; and food waste not being considered at all. It would be difficult to assign an objective figure to how much these overlooked factors would add to the 50% of cropland calorie loss. But given how substantial each of them is in its own right (especially the 30-40% of all produced food going to waste), it would not be surprising if it reduced the study’s produced-to-consumed ratio by at least 35 percentage points, down to 15%, and probably to more like 5%.
To put it another way, this would mean that for every twenty pounds of food harvested in the field (in the U.S.), only three—and probably more like one—pound(s) are actually eaten by humans. So much for the industrial food system’s vaunted economy of scale.
1West, P. 2025. Only half of the calories produced on croplands are available for human consumption. Research Gate. https://www.researchgate.net/publication/394005686_Only_half_of_the_calories_produced_on_croplands_are_available_for_human_consumption#:~:text=Abstract%20and%20Figures,every%20calorie%20of%20boneless%20meat
2Fleck, A. 2025. The Enormous Scale Of Global Food Waste. Statista. (UN Environment Programme Food Waste Index Report 2024. Think Eat Save: Tracking Progress to Halve Global Food Waste.) https://www.statista.com/chart/24350/total-annual-household-waste-produced-in-selectedcountries/#:~:text=China%20wastes%20an%20estimated%20108.7%20million%20tonnes,3.9%20and%206.5%20million%20tonnes%20per%20year.
3Responsible production and consumption. 2017. The World Bank. https://datatopics.worldbank.org/sdgatlas/archive/2017/SDG-12-responsible-consumption-andproduction.html#:~:text=Food%20loss%20can%20occur%20at,Kilocalories%20per%20person%20per%20day

0 Comments