

The (Now Even Greater) Field-to-Fork Dropoff
I was really happy to discover the material food flow chart (below) published by the Center for Sustainable Systems at the University of Michigan. It’s been so useful in my blogs e.g, The Evidence and webinar. https://justgrowityourself.com/ in helping to explain the gross inefficiency of the industrial food system (IFS). Most importantly, it shows that only 15% of the U.S. food biomass produced in the field makes it all the way to the fork of the consumer, which means that 85% drops out along the way. Unfortunately, the chart was created in 1995, now almost 30 years ago. Is it equally useful in understanding how the industrial food system works today?
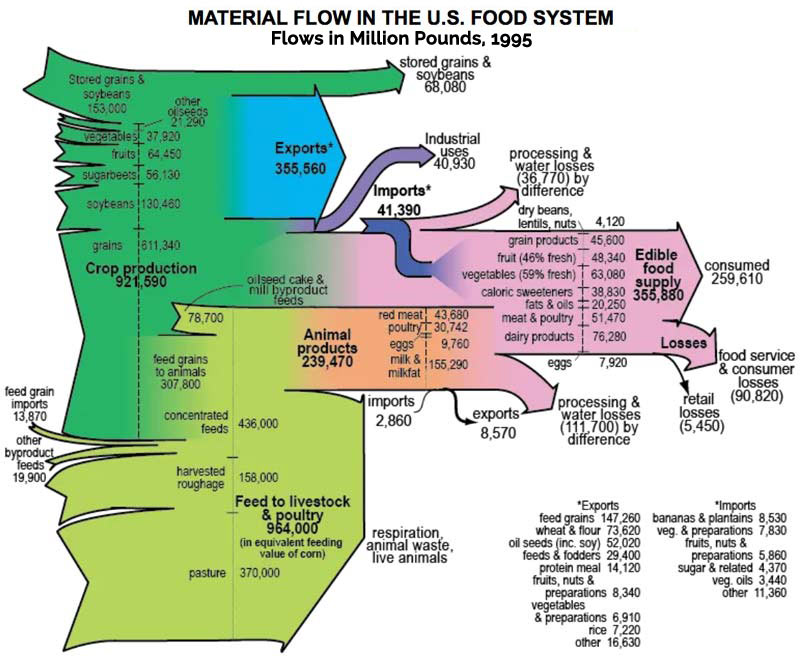
According to the chart, field-harvested food begins at the left as “Crop production” and “Feed to livestock and poultry.” Various amounts of initial production then drop out along the supply stream as:
- Stored grains and soybeans
- Exports
- Industrial uses
- Respiration, animal waste, and live animals
- Processing and water losses
- Retail losses
- Food service and consumer losses
What remains at the end of this grand 1,500 mile food journey is designated as “consumed,” that is, eaten by humans. However, bear in mind that this and all the other figures were not intended to be purely quantitative; rather, they’re more of a life-cycle depiction of relative amounts of food biomass as they move through or out of the food chain.
Know also that although I have a PhD in botany (University of Wisconsin), and have published research in crop breeding, I’m not an agricultural economist. That’s why I’d love for a good ag economist, or even better, a team of them, to create an update of the Michigan study, just to see if my assessments are on target.
All that said, it’s clear even to a non-specialist that some aspects of the food system have indeed changed, even though the major components would be much the same today. So let’s explore what’s different about the most prominent of these changes, and how they might impact the overall percentage of food that gets from field to fork.
Exports
First, this table to shows how exports and imports have changed since 1995, from two different perspectives, material and cash.
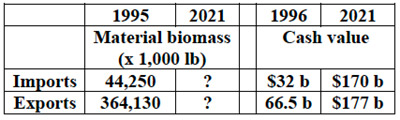
According to the USDA , in 1996 the cash value of agricultural exports ($66.5 billion) was about twice as much as imports ($32 billion), even though the chart shows that the relative material weight of exports was a whopping eight times as much. I couldn’t find updated material weight values, so I had to use cash values for 2021.
Now, by 2021 the cash value of U.S. exports was only 5% greater than imports. So even if the cash-to-material weight ratios were the same as in 1995, the proportion of material food biomass lost to exports in 2021 probably wouldn’t be much different from 1995. In other words, we now import very nearly as much as we export, at least in terms of cash value. And that means that exports—even though they now comprise an impressive 20% of agricultural production—don’t significantly change the percentage of material food biomass that makes it from field to fork.
Meat
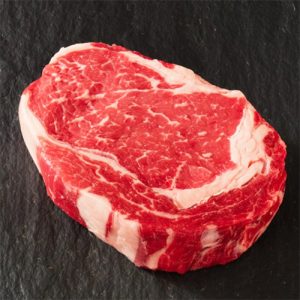 Point of definition: by “meat” and “livestock” agronomists mean beef and pork, not poultry, so just keep that in mind. Looking again at the chart, we see that the material amount of 964,000 that went to “Feed to livestock and poultry” comprised half of the initial total food biomass of 1,885,590. U.S. meat production rose from 34 million tons in 1995 to 49 million in 2020, a 45% increase. In addition, our per capita consumption of meat has ramped up by 10% since 1995. These increases would be accompanied by commensurately higher processing losses (all other things being equal, but see below). That, in turn, would decrease the percentage of initial food biomass reaching the consumer’s fork from what it was in 1995 by I’m very conservatively guessing about 3%.
Want to know why I think that’s a pretty safe bet? If so, bear with me as we dive a little deeper into processing losses.
Since U.S. meat production has increased 45% since 1995, but consumption only 10%, most of the production bump has undoubtedly gone to exports (think especially pork to China). But in cash value, exports are now within 5% of imports, so there would be no significant net increase in corresponding processing losses, right? Wrong, since most of the total of 12% lost to animal waste, respiration, water, and processing in 1995 (according to the chart) occurred before meat products were exported. As it would today. So yes, you would expect a sizable—and commensurate—increase in processing losses since 1995.
Some agronomists may claim that increased crop and livestock yields, new technology, and the rise of CAFOs (concentrated animal feeding operations) since 1995 would reduce rather than increase processing losses per pound of meat produced. I doubt it, as most of those changes likely do more to boost crop production efficiency than to reduce post-slaughter losses. Besides, there’s been a steady increase in system-wide waste (see below), which suggests that industry is not significantly reducing post-slaughter processing losses per pound of meat production. Agronomists, if I’m wrong, please weigh in.
Now, consider again that 12% in processing losses from livestock and poultry in 1995. If a commensurate proportion were lost due to the 45% increase in meat production since then, it would amount to 12% of 45%, which would be an additional 5.4 % in losses to the material food flow. However, some of that loss would be due to poultry and eggs, so I’m guessing conservatively that new losses due to increased meat processing would account for at least 3% of the total lost.
Do you begin to see why agricultural economics is such a large, complex field of study, with at least eighteen interdependent major factors to consider?
Processed foods
“Processed” means any significant alteration in the material nature of raw food, which can range from so little as to be unnoticeable to so much that the result is what Michael Pollan calls “food-like substances.” In the industry, the range is categorized as: 1) raw or very lightly processed (e.g., fresh eggs and vegetables, raw meat, pasteurized milk, fermented foods); 2) processed culinary ingredients (e.g., plant oils, flour, pasta from whole grains); 3) processed (e.g., canned food, some cheeses); and 4 ultra-processed (e.g., sugary drinks and cookies, breakfast cereal, and ready-to-eat frozen meals). Ultra-processed now makes up 60% of what the average American eats, while less processed foods make up most of the remainder.
If the production of processed food had increased substantially since 1995, it would proportionately lower the percentage of initial food biomass reaching the consumer’s fork, as processing results in considerable losses of both water and substantive food matter.
Americans have been consuming more and more processed food for decades, but it’s not clear just how much since 1995. The most pertinent evidence I could find was a study reporting that processed food consumption grew from 53.5% of consumed calories in 2001 to 57% in 2018. That’s not much, so it’s unlikely to have significantly affected the proportion of initial food biomass that gets to the consumer fork.
Industrial
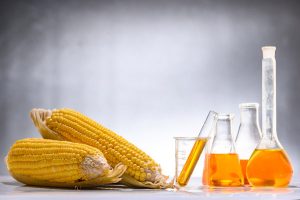 Even in 1995, some of the initial material harvest went to purely non-food industrial uses. However, there was virtually no loss of corn and soybeans to ethanol and biodiesel production. Now, 40% of the corn crop and 30% of the soy crop goes to biofuels, although distillers grain, the byproduct of ethanol production, would divert some of that back into the food stream as livestock feed. Still, since corn and soy each account for about 10% of total U.S. cropland, you could expect the impact to shake out as follows. If production acreage (yet another way to assess relative amounts of food flow) is any indication, 40% of the 10% of cropland devoted to corn would lead to 4% of the total produced food, and 30% of the 10% devoted to soybeans would result in 3% of the total. So altogether, biofuels likely come to an additional 7% decrease in the percentage of food biomass that gets from field production to the consumer’s fork since 1995.
National Geographic reports that 9% of food production now goes to industrial purposes (including biofuels)] However, the food flow chart shows only 2% of initial biomass going to industrial in 1995. This comports well with my estimate of 7% now going to biofuels, assuming that other 2% goes to industrial uses other than biofuels, as it did in 1995.
Increasing Waste
According to the EPA, in 2010 thirty-one percent of the food supply was lost, which was fifty percent more than in 1970. In 2018, more food reached landfills than any other material, and a study by the Boston Consulting Group in that year estimated that by 2030 food waste will have increased by another third unless urgent action is taken. Let’s see, another third added to thirty percent would result in forty percent lost to waste, which is what I’ve already seen reported. This starkly suggests that losses due to waste in processing, water, retail, food service, and consumers are taking an increasing toll on the proportion of food that gets from field to fork. How much since 1995 is anyone’s guess, but it’s got to be considerable.
So Overall . . .
To sum up, compared to the loss of 85% of the material food flow between field and fork in 1995, for 2022 I see no significant addition to the proportion of losses due to exports and increased consumption of processed food. However, I do expect additional losses of 7% due to the massive introduction of biofuels, and 3% generated by the huge increase in meat production. That would add up to 10% more food removed from the supply chain than in 1995. Which, if my estimates are on target, means that 95% of the material harvested in the field is removed from the food chain before it reaches the customer’s fork. And that’s not even accounting for steadily increasing food waste in the system as a whole. So my best estimate is that now only 5% of field-harvested food reaches the American consumer’s fork.
What? Just 5%?!!
How on earth could the industrial food system be that inefficient and still supply thousands of supermarkets with an average of some 40,000 items each, as well as stocking restaurants, schools, and the rest of the $5 trillion extended retail food service market for 332 million people?
Well, first recall that the authors at the UM food flow chart documented that 85% of initial food biomass was already dropping out between field and fork in 1995. So the diversion of an additional10% in 2022 should not be surprising given the large increases in biofuels and meat production over the last twenty-seven years.
Second, we know that on a land footprint basis, the U.S. industrial food system is incredibly inefficient, as it takes three acres to feed an American for a year, compared to just one percent of that for a subsistence self-sufficiency garden. Heck, even western Europe’s industrial food system requires only 20% as much land per capita as the U.S. Then there’s the half of Russia’s food supply in 2008 produced by household gardens on just 3% of their agricultural land (the other 97% occupied by industrial). Evidence like this indicates that the industrial food system is not even remotely as efficient as the narrative would have us believe.
Third, the IFS would be unable to transfer even 5% of its initial harvest to the consumer fork were it not for the $trillions of its expenses it fobs off to other entities in our society, which largely hide its enormous diversions and waste. And forth, the IFS annually depends on $120 billion in government food aid to serve those it can’t adequately reach, leaving 18% of the population food insecure and 7% of our children stunted due to inadequate nutrition.
In view of all these indicators, is 5% field-to-fork efficiency really all that surprising? By way of comparison, the garden-to-fork efficiency of a 35’ x 40’ plot planned and maintained the way I did it is about 95% for a year’s supply of food, on 1% of the land the IFS requires.


0 Comments